Collaboration between producers and industry science, based on the developing and current information technology available, is yet to achieve a cohesive focus.
This stagnation in the British pig industry must be overcome by investment incentives – otherwise our global competitors will gain a game-changing advantage.
There is an opportunity for industry-wide collaboration between producers, software and hardware manufacturers, feed and genetic supply companies, major integrators and established brand supply chains to find the balance between sustainable efficiency and care. Breeding herd performance has achieved improvements through focusing on a parity structure of 1 to 5 and a replacement gilt-management programme that is concentrated on the transition from puberty to the coming-of-age of the sow at her second parturition.
The strategy is based on a statistical process control (SPC) that has increased the cash flow cost-efficiency of the breeding herd. Despite encountering reservations among producers of my generation, this SPC, applied to the breeding herd, delivers.
I am encouraged by the possibility of an even more valuable SPC for the feeding herd.
First, let’s qualify the term ‘cash flow cost-efficiency’.
In the context of my work, it means that the maximum percentage of every penny spent on the day-to-day operation of the pig production enterprise produces a positive financial return. The balance of efficiency and care of this operation is reconciled to the demands of animal welfare and environmental sustainability.
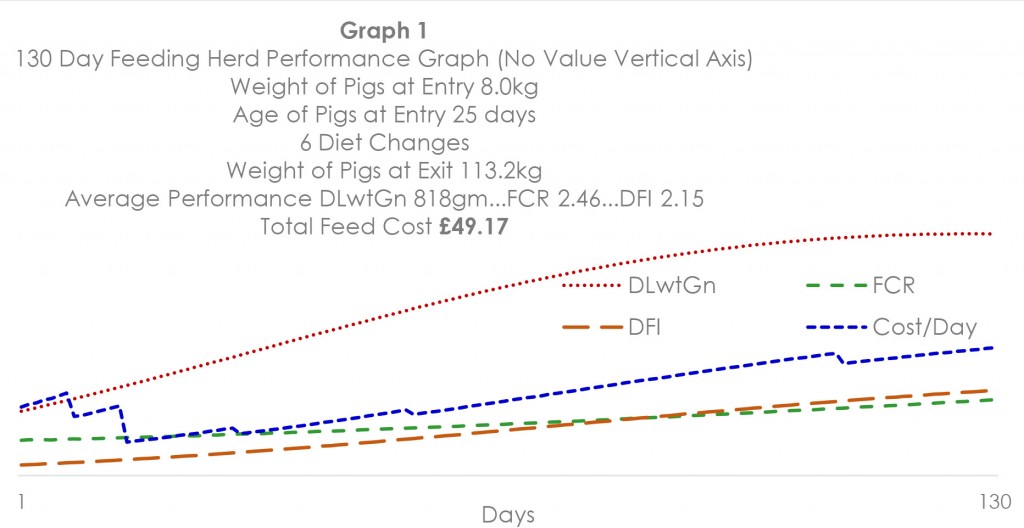
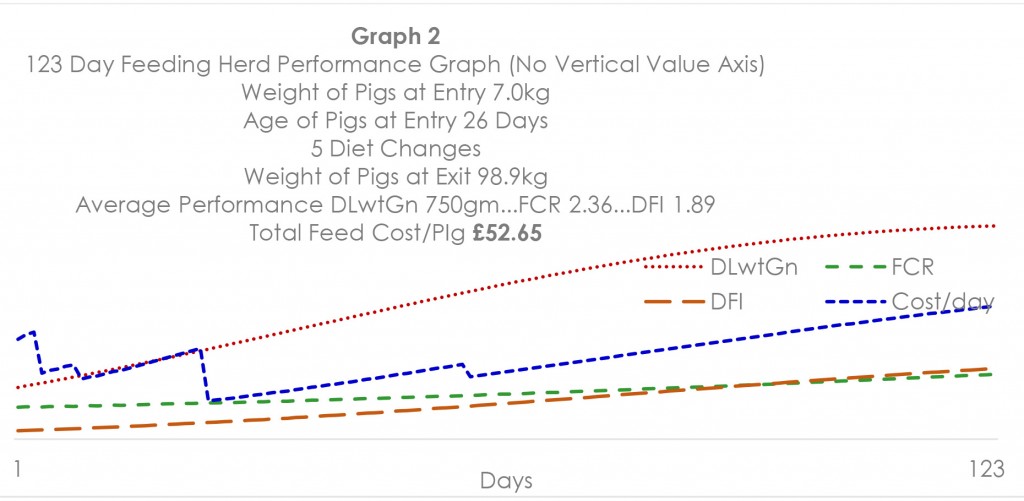
Below are two graphs I have generated to try and help me understand an SPC at the heart of feeding herd management.
An SPC is an integral part of quality control; its purpose being to make things happen, not to be a reaction to what has already happened. SPCs are developed by monitoring a process so you can learn what to expect.

Control charts are based directly on measurements of the process and show the variation. Ivor Allen, who helped me with the parity distribution analysis several years ago, gives this explanation: “If the process is ‘in control’, a variation is still present, but its variability is attributable to ‘assignable causes’, which are inherent in the process and the conditions. This allows the operator to judge, from the control chart, whether to act or leave the process alone. Much inefficiency, and therefore cost, can be introduced by unnecessary changes being made when a process is ‘in control’.”
By determining the root cause of change, prevention of further occurrence can then be initiated. An SPC forms part of an overall ‘total quality’ strategy.
The following definitions of ‘quality’ are consistent with SPC:
• Closeness to target
• Minimising variation.
The reported measurement of SPC will demonstrate how much variation is present. This variation is either ‘assignable’, which is understood as part of the process, or ‘natural’, describing variations that are outside of control.
Ivor’s explanation mentioned the effect of unnecessary change on efficiency and cost. The bases upon which most of the ‘day-to-day’ management changes we make in pig production are borne of impatience with counter-intuitive results.
“In response to consumer demands fir sustainable and safe food production, we must define an SPC for the feeding herd”
Pig producers should take time to pore over all the evidence they can muster, and then, in collaboration with their vet, nutritionist, geneticist, consultant and staff, decide a management strategy designed to deliver that cash flow cost balance of efficiency and care.
Any change to this strategy must be an agreed improvement, based on further evidence. If something is changed every week, then the management is poor and the production process is out of control. This is the tip of an iceberg that it behoves the industry to address, because it is a significant contributor to the historical use of antimicrobials.
The graphics below include a growth curve (Daily live weight gain – DLwtGn) and a daily feed intake curve (DFI).
Data is taken from the tables in the AgroVision pig recording programme, and represent a reference curve for weight gain and feed intake of one indoor and one outdoor system being recorded. The feed conversion ratio (FCR) is calculated using the DLwtGn and DFI. Daily feed cost per pig is calculated against a cost per tonne of each ration in the feed schedule, using an imposed feed diet change-timing schedule.
These two graphs distil information into a valuable production feed cost comparison that includes entry and exit weights, feed regimes and subsequent performance.
They are artificial only in the fact that they report a calculated growth curve and the diet change points are imposed, not actual.
However, it is possible to plot forecasted and/or real data, taken from on-farm measurement.
I believe the possible process control could work like this. A two-stage approach would impose forecast growth and DFI curves, based on a combined genetic and nutritional expectation. The second stage would calculate the same two data curves from collected farm data.
Either way, the cost-per-day data line on the graph would represent the expression of the process control and direct development of the diet schedule.
Two recorded weights are required – the weights of the pig and the feed. The feed-usage weight is collected using load cells installed at the feed bin or the feeding hopper and the weight of the pigs as a total, or a random selection, of the same numerical size. The number of days a trial cohort of pigs weight is collected in the trial period will determine the accuracy of plotting the data for process control.
There are already innovative information technologies able to feed data into the overall requirement to develop an SPC.
Including further IT makes it possible to monitor and measure what are presently, on most units, ‘natural’ variations relating to the environment, as well as any delivery compromises of water and feed that corrupt the assignable variations. The employment of environmental controls increases what is assignable and improves the effectiveness of the SPC.
The Pig Improvement Via Information Technology (PIVIT) project, completed in December, concluded that the scope of IT available for monitoring production returns long-term value. This is derived from the data, streamed and collected for analysis, enabling each unique business to benchmark itself to improve and maintain cash flow cost efficiency. What is not presented in the graphics is any record of the contribution management of the environment makes to efficiency.
PIVIT acknowledges that it is not the building in which the performance occurs, but the performance in the building that should form the basis for building design.
The project also highlighted the value of shared comparative data to inform the direction of research and how each element of the combined process of housing, feeding and growing relates to the balance of efficiency and care. Hugh Crabtree, chairman of the NPA Allied Industries Group, described this opportunity as a ‘living laboratory’.
Management strategies can target diet schedules to fit supply combinations, production systems and seasonal variation. An SPC protocol, unique to individual businesses, could be employed to deliver an outcome with significant cash flow cost reduction. This is as much a part of industry survival as marketing.
If the industry is to incorporate developing science into a response to the demands being made by consumers for sustainable and safe food production, then we must define an SPC for the feeding herd.
So we must collaborate in a confluence of the world outside our biosecurity fences with the world inside them.


